

Metering & usage in the Recurso dashboard
The two usage screens
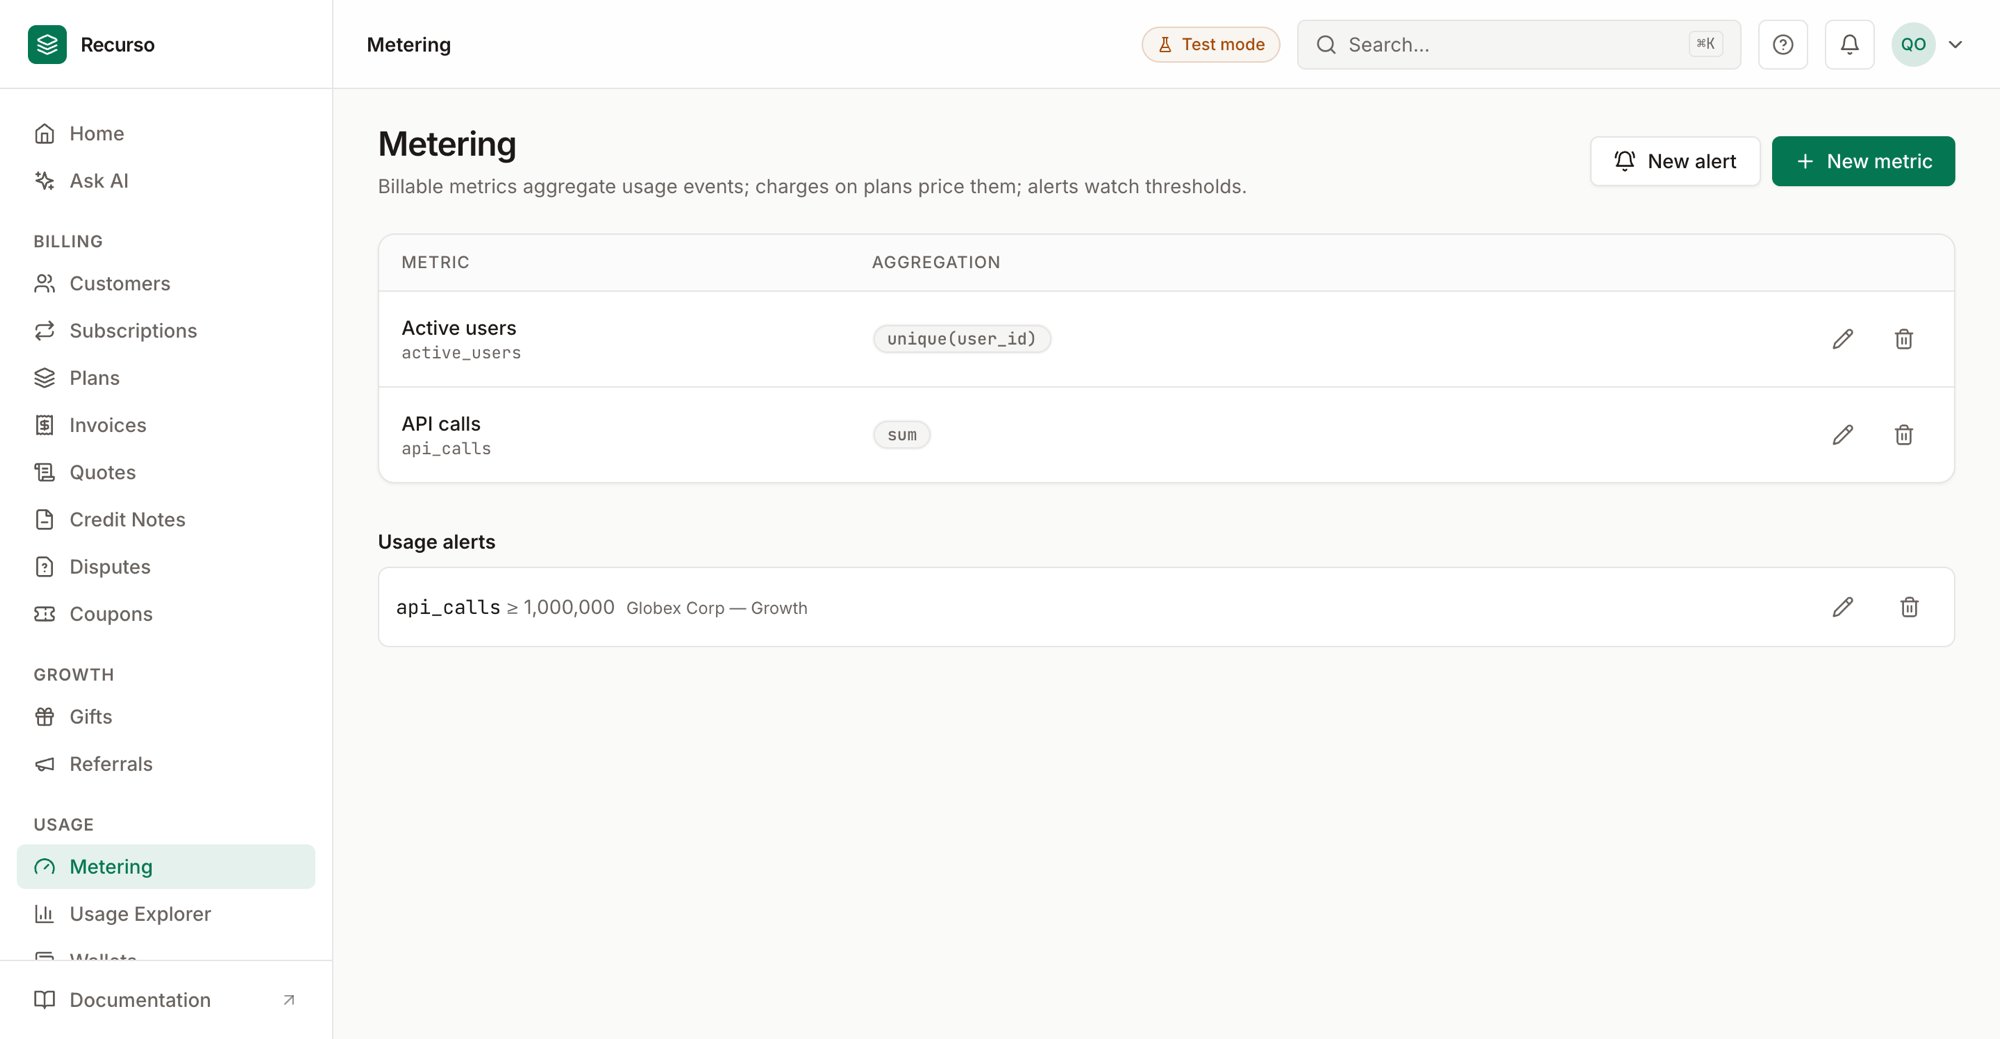
Usage-based billing in Recurso has two dashboard screens:- Metering — define the billable metrics that turn raw usage events into billable quantities, and set usage alerts that fire at thresholds.
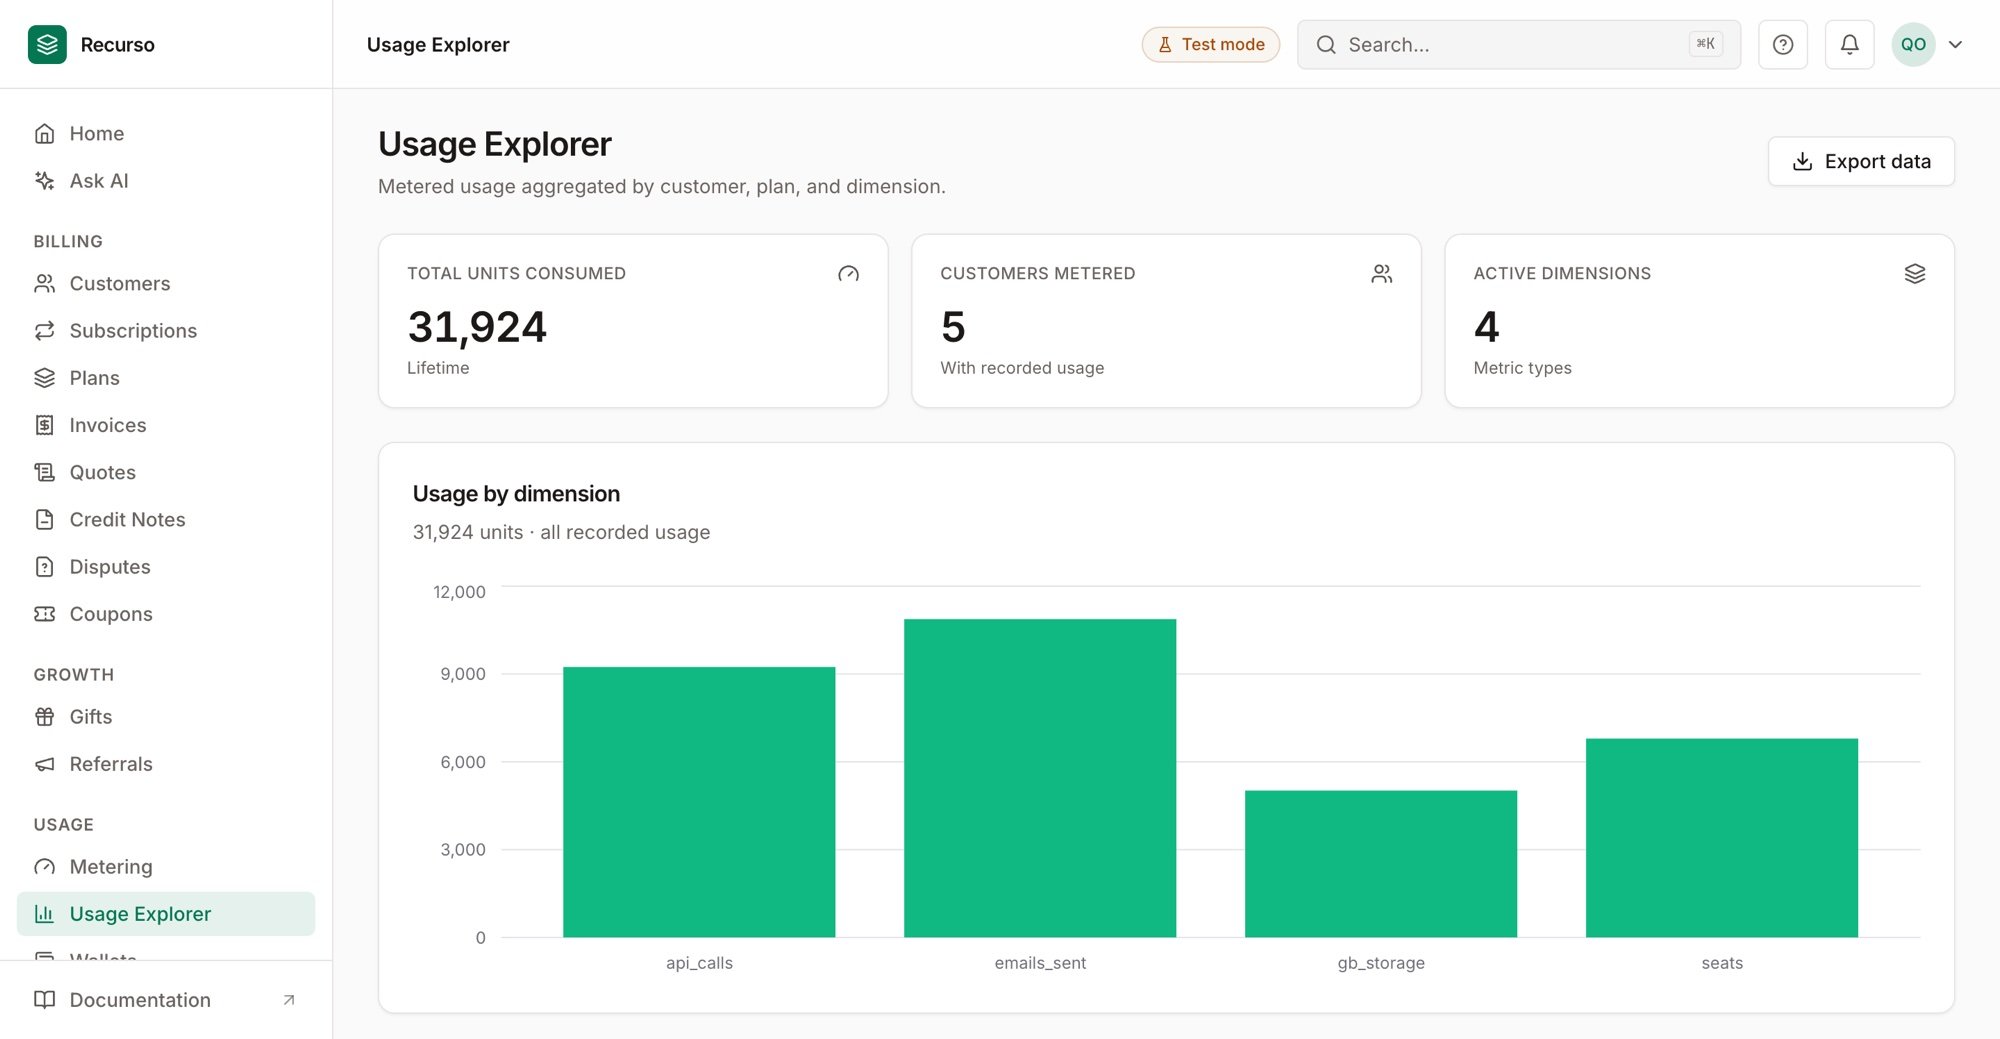
- Usage Metering — inspect the usage that’s actually been recorded: aggregates by customer, plan, and dimension, plus the raw ingestion stream.
The billing loop is: your app records usage events → a billable metric
aggregates them by its code → a plan charge prices the aggregate →
usage alerts watch the running total.
Billable metrics
Open Metering. The table lists each metric with its name,code, and
aggregation type.
A metric’s code doubles as the usage-event dimension it aggregates — when
your app posts a usage event on dimension api_calls, the metric with code
api_calls picks it up.
Create a metric
1
Click New metric
Opens a side panel.
2
Name and code it
- Name — a human label, e.g.
API calls. - Code — the event dimension, e.g.
api_calls. Immutable once set.
3
Choose an aggregation
Two aggregations show an extra field in the editor:
uniqueandpercentile→ a Property / Percentile (field_name) field: the property whose distinct values you count, or the percentile1–99(e.g.95).custom→ an Expression field: a formula overquantityand numericproperties.*(e.g.quantity * properties.multiplier), summed over the period. It’s validated as you save, so a bad formula is caught here, not at invoice time.
weighted_sum needs no extra field — report a signed quantity (+5
when five seats are added, -2 when two are removed) and it bills the
average level held over the period.4
Create metric
You can edit a metric’s name, aggregation, property, and expression later
(the code stays fixed), or delete it.
Usage alerts
Below the metric table, Usage alerts watch a subscription’s usage and notify you when it crosses a threshold. Each alert fires once per billing period, via theusage.alert.triggered webhook plus an email.
Create an alert
Click New alert and fill in the side panel:- Subscription — pick from active (non-canceled) subscriptions.
- Metric — pick one of your billable metrics.
- Threshold type — Absolute quantity, or Percent of entitlement limit.
- Threshold — the number (or percent) that triggers the alert.
Recorded usage
Open Usage Metering to see what’s actually been metered.Filters and stat cards
Filter by customer and plan. Three stat cards summarize the filtered view:- Total Units Consumed (lifetime)
- Customers Metered (with recorded usage)
- Active Dimensions (distinct metric types)
These figures are lifetime aggregates, not a time series — the chart shows
the split across dimensions rather than usage over time.
Recent events (ingestion stream)
At the bottom, Recent events is the raw ingestion stream, newest first — use it to verify events are landing before they roll up into metrics. Each row shows the timestamp, customer, dimension, quantity, and idempotency key (transaction id). Filter by dimension and Refresh to re-pull. Usage is ingested by your app posting to the usage-events endpoint; events show up here immediately.Related
Plans & products
Attach a usage charge to a plan and set the per-unit or tiered price.
Subscriptions
The subscriptions whose usage is metered and alerted on.
Usage Explorer
Usage Explorer — usage by dimension, with the raw ingestion stream